API monitoring
API monitoring that speaks your endpoint's language
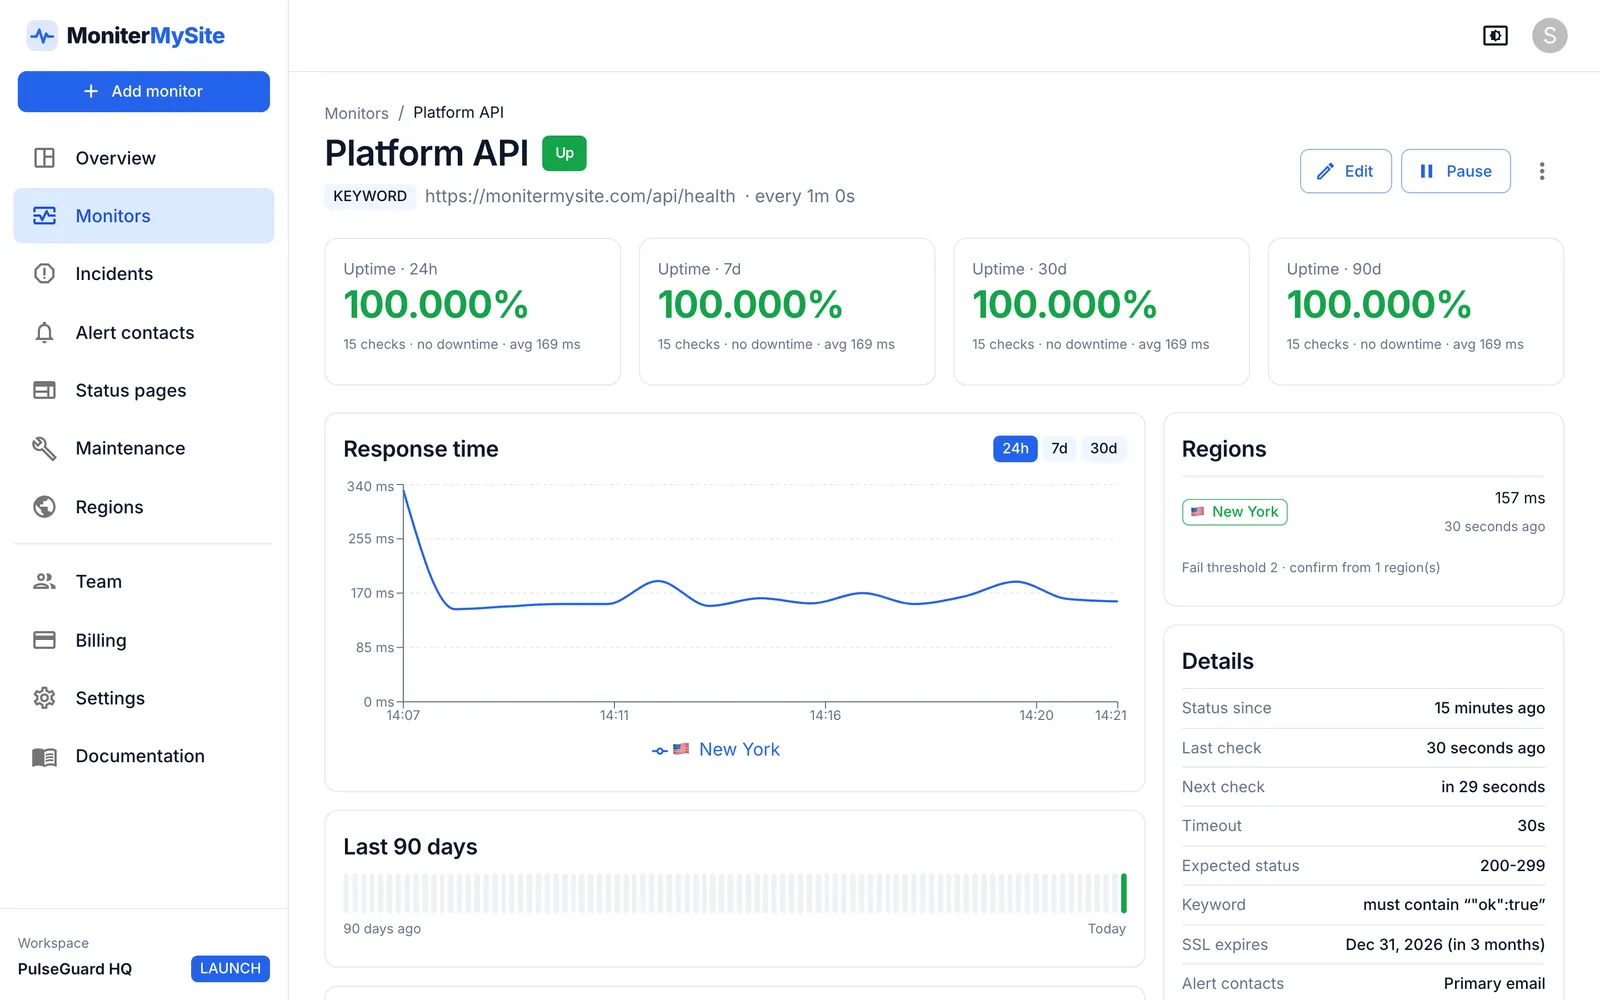
API monitoring sends real requests to your endpoints on a schedule and alerts you when the response is wrong, slow or missing. MoniterMySite lets you choose the method, headers, body and authentication, define which status codes count as healthy, set a response-time threshold and check from five regions as often as every 10 seconds.
- GET, POST, PUT, PATCH, DELETE, HEAD or OPTIONS with custom headers and a JSON or form body
- Basic or bearer authentication, with credentials encrypted at rest and shown masked
- Expected status codes such as 200-299,301 and a per-monitor response-time threshold
How it works
Describe the request
Add an HTTP(S) monitor, paste the endpoint URL and set the method, headers, body and auth exactly as a client would send them. Run a test check to see the real status code and response time before saving.
Say what healthy means
Enter the expected status codes, a timeout, and optionally a response-time threshold. If the body matters, add a Keyword monitor for the same endpoint that asserts a phrase is present or absent.
Check from several regions
Pick the regions to check from and how many must agree. Checks rotate between them, so a regional network problem is not mistaken for an outage.
Alert, then resolve
When the required regions confirm failures, an incident opens and your contacts are notified with the error. Recovery is sent with the total downtime, and PagerDuty incidents resolve automatically.
What you get
Any method, any headers
Send the verb your endpoint expects and whatever headers it needs: content types, API keys, correlation IDs.
JSON or form bodies
Attach a request body to POST, PUT or PATCH checks, so you can exercise a real write path or a GraphQL query rather than only a static health route.
Authentication
Basic auth with a username and password, or a bearer token, configured on the monitor. Secrets never appear in the UI once saved.
Expected status codes
Healthy is whatever you say it is: a range like 200-299, a list like 200,301, or a single code such as 401 for an endpoint that should reject anonymous requests.
Response-time thresholds
Set a threshold between 50 ms and 60 seconds. When a check exceeds it you get a slow-response alert, once per episode, while the endpoint is still counted as up.
Keyword assertions
A Keyword monitor shares every request option above and additionally checks that a word or phrase appears, or does not appear, in the response body.
Why APIs need their own monitoring
A website monitor loads a page and looks at the status code. Most API endpoints need a method other than GET, a body, an authentication header and a specific content type, and many answer 200 while returning an error object. Pinging the root URL proves the load balancer is alive and nothing more.
Useful API monitoring means sending the request a client would send and judging the reply by the same rules: accepting a 401 or 204 where that is the correct answer, failing a check when a required phrase is missing from the body, and treating a slow reply as a warning before it becomes a timeout. Everything on this page is a standard HTTP(S) or Keyword monitor; there is no separate product to buy.
What you can configure on an API monitor
All of the following are set per monitor from the Add monitor page, and can be changed later without losing history:
- Method: GET, POST, PUT, PATCH, DELETE, HEAD or OPTIONS
- Headers as name and value pairs, and a request body for methods that take one
- Authentication: none, basic or bearer
- Expected status codes, defaulting to 200-299
- Follow redirects on or off, and SSL validation on or off
- Timeout from 1 to 60 seconds; 10 seconds suits most APIs
- Response-time threshold for slow-response alerts, from 50 ms to 60 seconds
Alerting, webhooks and automation
Down, recovery and slow-response events go to the contacts attached to the monitor. Webhook contacts receive a JSON POST for every event with the monitor, incident, regions and cause. If you set a signing secret, each request carries X-MoniterMySite-Timestamp and X-MoniterMySite-Signature headers so your endpoint can verify the HMAC-SHA256 signature; requests are retried three times if your endpoint does not answer with a 2xx within 10 seconds.
Team chat and paging work the same way: Slack, Discord, Microsoft Teams, Google Chat and Telegram on Launch and above, PagerDuty Events v2 with automatic resolve on Growth and above. Maintenance windows mute alerts during planned deploys and exclude that time from uptime figures, and a status page can show the API as a component with its own uptime bar.
Plans and limits
API monitors count towards your plan's monitor allowance; interval, regions and channels are what change between plans.
| Plan | Price per month | Monitors | Fastest check | Regions per monitor | Alert channels |
|---|---|---|---|---|---|
| Starter | Free | 10 | 5 minutes | 1 | Email, webhook |
| Launch | $9 ($7.50 yearly) | 100 | 60 seconds | Up to 3 | Adds Slack, Discord, Teams, Google Chat, Telegram |
| Growth | $29 ($24 yearly) | 200 | 30 seconds | All 5 | Adds PagerDuty |
| Summit | $79 ($65 yearly) | 1,000 | 10 seconds | All 5 | All eight |
Frequently asked questions
Can I monitor an API that requires authentication?
Yes. Choose basic auth and enter the username and password, or choose bearer and enter the token. If the API expects a custom header such as X-API-Key instead, add it as a header.
Can I send a POST request with a JSON body?
Yes. Set the method to POST, add a Content-Type header, and paste the body. The same works for PUT and PATCH, and for GraphQL, which is a POST with a JSON body.
My endpoint returns 401 or 204 on purpose. Will that count as down?
Not if you tell the monitor. Expected status codes accept ranges and lists, so 204 or 200-299,401 is fine. By default only 2xx is treated as healthy.
Can I check that the response body contains a specific value?
Use a Keyword monitor for that endpoint. It supports the same method, headers, body and auth as an HTTP monitor and fails the check when the phrase you set is missing, or present if you choose the opposite condition. Matching is case-insensitive and runs against the raw response body.
How do I allow the monitoring requests through my firewall or rate limiter?
Each of the five regions has a published, stable IP address and every check sends the user agent MoniterMySite/1.0. Both are listed on the allowlisting page in the docs. A 403 or 429 on the monitor page usually means a WAF or rate limiter is blocking those addresses.
Keep reading
Start monitoring in 30 seconds.
Nothing to install. No credit card. 10 monitors free, forever.